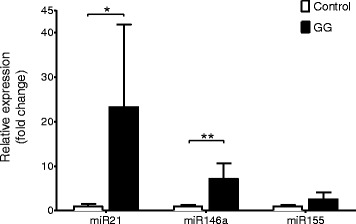
Fig. 1.

Quantitative real-time PCR of miR21, miR146a, and miR155 in GG. Expression levels of miR21, miR146a, and miR155 in GG (n = 9; frozen material). Data are expressed relative to the levels observed in control cortex (n = 8, frozen material); miRNA expression was normalized to that of the U6B small nuclear RNA gene (Rnu6B). The error bars represent SEM; statistical significance: *p < 0.05; **p < 0.01
