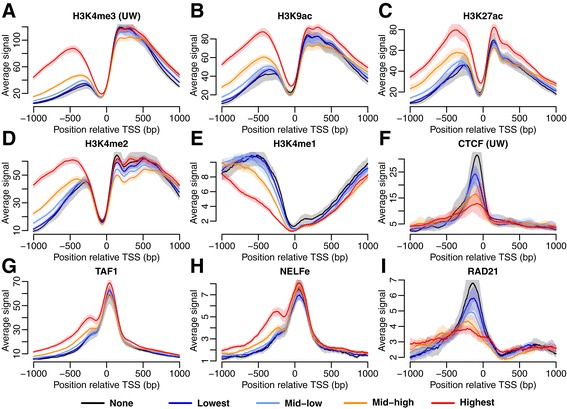
Figure 6.

Differences in HM and TF signal for genes grouped by the level of antisense transcription. Results shown for K562 (cytosol, polyA-). The average signal (with 95% CI) is shown in a region ±1 kb from the TSS. The signal shown is either HMs typical for (A - C) promoters, (D) promoters and enhancers, (E) enhancers, or (F - I) TFs.
