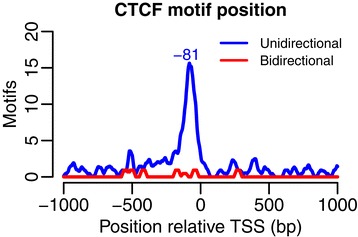
Figure 7.

Position of the CTCF motif in K562 (cytosol, polyA-). The per-bp motif coverage was computed in a region ±1 kb from the TSS for uni- and bidirectional genes separately. The signal shown was averaged over a ±20 bp window and the position with the highest motif enrichment marked.
