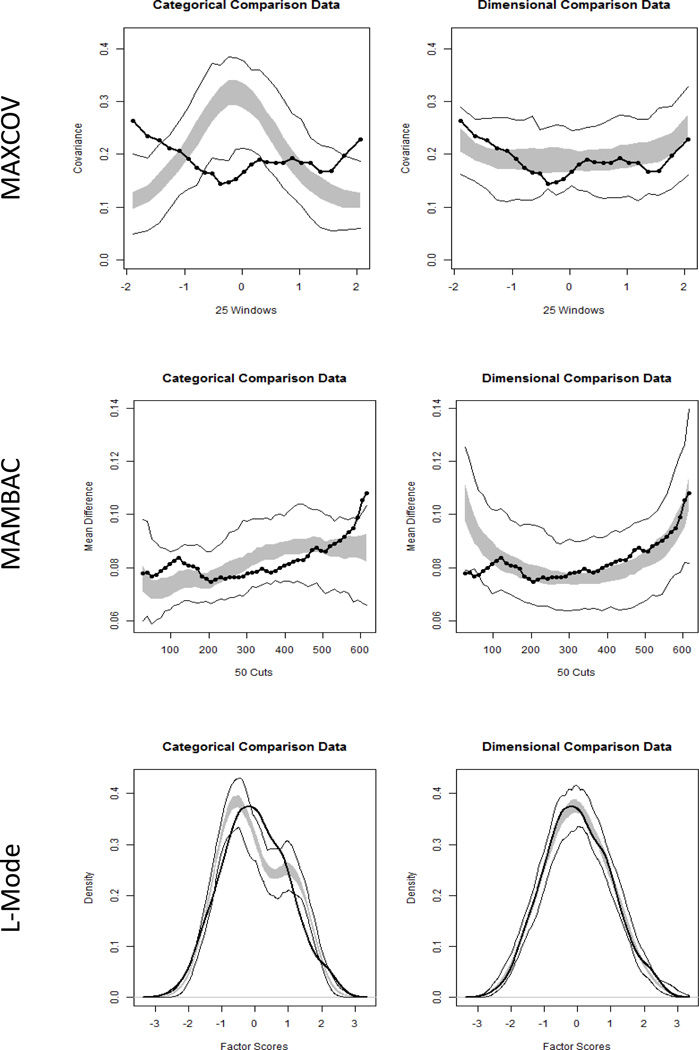
Figure 2.
Taxometric functions for indicators of secure base script knowledge as measured by the adolescent version of the ASA administered to Sample 1 (SECCYD). The dark line in each panel represents the empirical function. The shaded region represents the range of values that would be expected 50% of the time under categorical (left column) or dimensional (right column) models.

