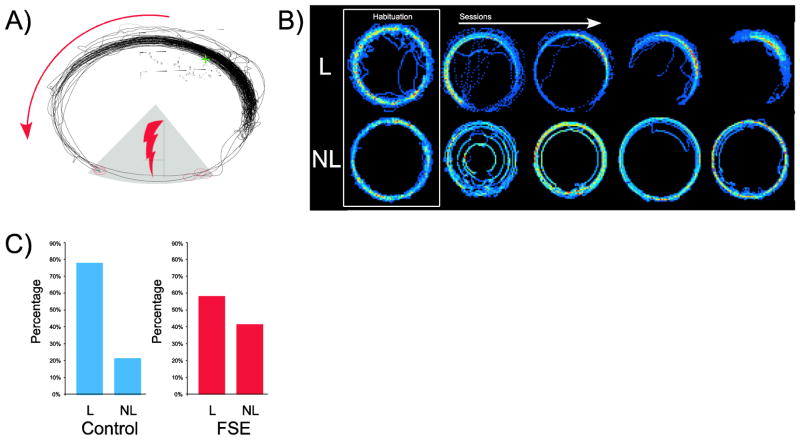
Figure 1.
Illustration of the active avoidance task and behavioral results: A) Rats were tethered to a shock cable connected to a pin that was subcutaneously implanted on the back of the rat’s neck. An LED at the end of the shock cable (indicated by green crosshair) was used to signal the rat’s position in the room frame while the arena rotated counter-clockwise. The rat’s path is indicated by black lines. When the rat entered the shock zone (gray sector in southern position), the rat received a mild electrical shock (indicated by open red circles); B) Dwell-time maps during habituation and training sessions. Red colors indicate more time while bluer colors indicate less time. The top row shows examples of avoidance behavior over several sessions (left to right) from a rat that learned to avoid (L=Learner). Note that over the course of training the rat spends more time in a more circumscribed region of the arena, far from the shock zone. The bottom row shows examples over several sessions from a rat that did not learn to avoid (Non-learner=NL). The final training session on the far right looks similar to the habituation session; C) The percentage of learners (L) and non-learners (NL) in the control (left) and FSE (right) groups.

