Figure 1.
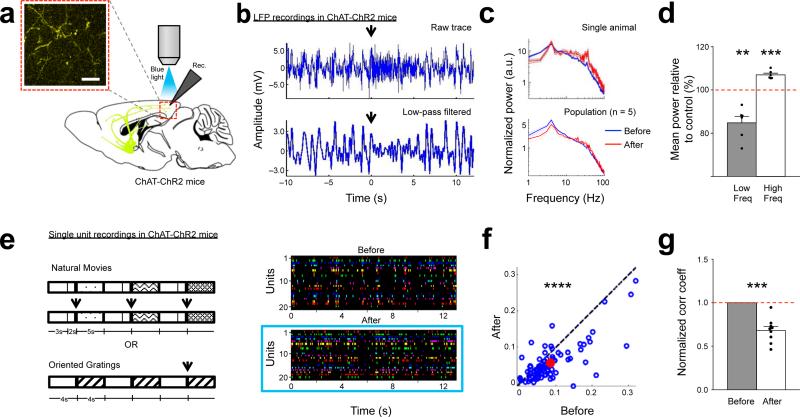
Optogenetic stimulation of ChAT-ChR2 expressing axons induces LFP desynchronization and decorrelation in layer 2/3 V1 neurons. (a) Experimental setup for LFP or single unit recording, with ChAT-ChR2 blue light stimulation through the objective (adapted from Paxinos GFK, Franklin KBJ, Academic Press, 2001). (Inset) Fluorescence image of ChAT-ChR2 axons in V1. Scale bar, 20 μm. (b) LFP desynchronization during ChAT-ChR2 stimulation at t = 0 s (arrow). (Top) Raw trace. (Bottom) Low-pass filtered < 5 Hz. (c) (Top) Example normalized power spectrum in an animal, 1s before (blue) and after (red) ChAT-ChR2 stimulation, averaged over 10 trials. (Bottom) Population mean normalized power spectrum across animals. Dotted lines indicate SEM. (d) ChAT-ChR2 stimulation induces a decrease in power of low frequency events (<10 Hz, mean power relative to control ± SEM, 84.8 ± 2.99 %, p = 0.0039, paired t-test, n = 5 animals) and increase in high frequency events (10 – 100 Hz, 107 ± 0.776 %, p = 0.0003, paired t-test). (e) (Left) Visual and ChAT-ChR2 stimulation protocol. ‘Natural movies’ comprised 3 movies of 5s duration (patterned boxes). ‘Oriented gratings’ comprised 3 trials of alternating 4s of blank screen and 4s of oriented gratings. ChAT-ChR2 stimulation is indicated by arrows. (Right) An example experiment showing neuronal decorrelation before (control, top) and after ChAT-ChR2 stimulation (blue box, bottom). Each panel shows responses of multiple single units recorded simultaneously during presentation of natural movies. Each unit is indicated by a different color. (f) Scatter plot showing single unit correlation coefficients before and after ChAT-ChR2 stimulation. Blue circles represent mean Pearson correlation coefficients for each neuron; red circle represents population averaged correlation coefficient. n = 85 units from 9 animals, P<0.0001, paired t-test, comparing mean correlation coefficients for each unit before and after photostimulation. (g) ChAT-ChR2 stimulation induces a significant decrease in the population averaged normalized correlation coefficient across experiments. n = 9 animals, p = 0.0001, paired t-test, comparing population averaged correlation coefficients across animals before and after photostimulation. ** p < 0.01, *** p < 0.001, **** p < 0.0001.

