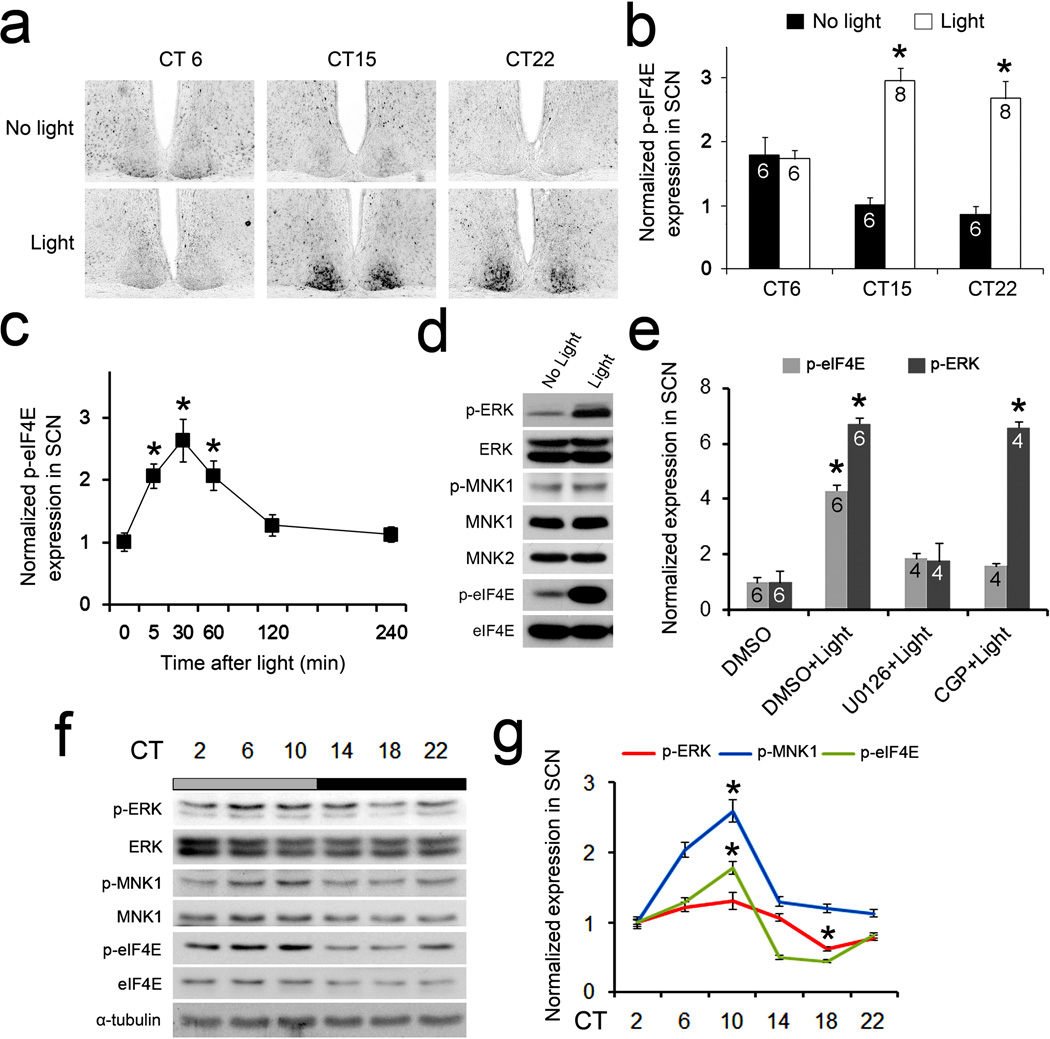
Figure 1. Light and circadian clock-regulated phosphorylation of eIF4E in the SCN.
(a) Representative microscopic images of coronal SCN sections show light-induced phosphorylation of eIF4E (at Ser209) in the SCN. Mice were exposed to light (55 lx, 15 min) during the day (CT6) or at night (CT15 and CT22) and sacrificed 30 min after light. Quantitation of intensities of p-eIF4E labeling is shown in (b). See “Methods” for the quantitation method.*P<0.05 vs. “No Light” (one-way ANOVA, F=2.97, P=0.044). (c) Time course of light-induced p-eIF4E expression in the SCN. A light pulse (55 lx, 15 min) was applied at CT15 and mice were sacrificed at indicated time points. *P<0.05 vs.0 min (one-way ANOVA, F=10.141, P=0.000). (d) Light-induced phosphorylation of ERK, MNK1 and eIF4E in the SCN. Western blots on SCN lysates before and 30 min after light exposure (55 lx, 15 min) at CT15 are shown. The blots of ERK, MNK1 and eIF4E were also shown as control. Full-length blots/gels are presented in Supplementary Figure 6. (e) Light-induced p-eIF4E and p-ERK expression in the SCN.MEK inhibitor U0126 (10 mM), MNK1 inhibitor CGP57380 (10 mM) or vehicle DMSO was infused to the lateral ventricle 30 min before light exposure. *P<0.05 vs. “DMSO” (one-way ANOVA, F=103.220, P=0.000). (f) Phosphorylation of ERK, MNK1 and eIF4E in the SCN over a 24-h period. Full-length blots/gels are presented in Supplementary Figure 6. (g) Phosphorylated proteins are quantified according to the levels of total proteins. *P<0.05 vs. CT2 (one-way ANOVA, F=18.964, P=0.000). The values are presented as the mean ± standard error of the mean (SEM).

