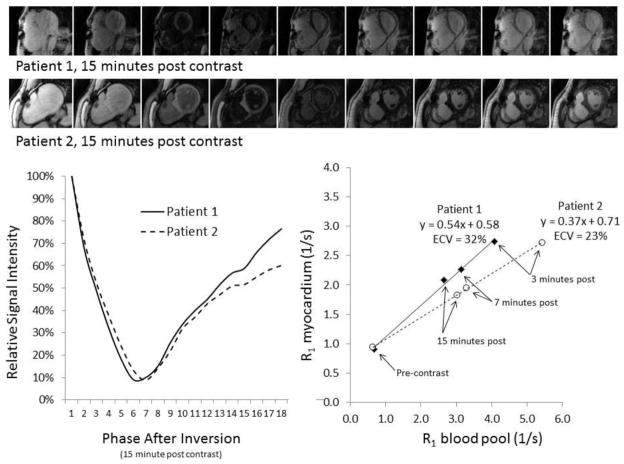
Figure 4.
Examples of extracellular volume (ECV) assessment in two patients with tetralogy of Fallot. A T1 inversion recovery sequence through the mid myocardium is obtained before and after administration of gadolinium contrast. Phases 3–10 of images taken 15 minutes after gadolinium are shown (top). These images are used to plot a time signal intensity curve from which exponential fitting is used to define T1 times (left graph). The reciprocal of each T1 time (R1) before and after gadolinium (three time points after injection are shown here) is plotted against corresponding times for the blood pool in the left ventricle (right graph). The linear slope of this relationship is used to quantify ECV. Compared to patient 2, patient 1 reaches a low signal (dark myocardium) sooner (top bar), consistent with a shorter T1 time (left graph), and a steeper slope (right graph), coinciding with a higher ECV.

