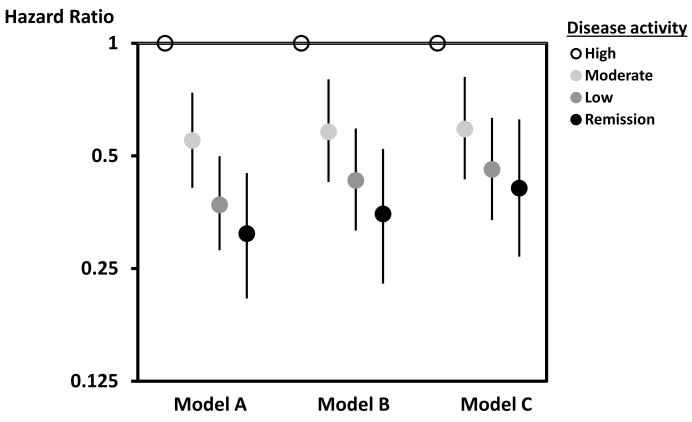
Figure 2.
This figure shows the hazard ratios for the primary analysis with the reference being high disease activity as measured by the Clinical Disease Activity Index. Model A is adjusted for age and gender only. Model B is adjusted for age, gender, age*gender interaction, and cardiovascular risk factors (prior MI, presence of CAD, diabetes, hypertension, hyperlipidemia, smoking, BMI (continuous), family history of MI, and aspirin use. Model C is adjusted for all variables in Model B + RA disease duration and baseline use of NSAIDs or selective COX-2 inhibitors, corticosteroids, disease modifying anti-rheumatic drugs, and biologic drugs.

