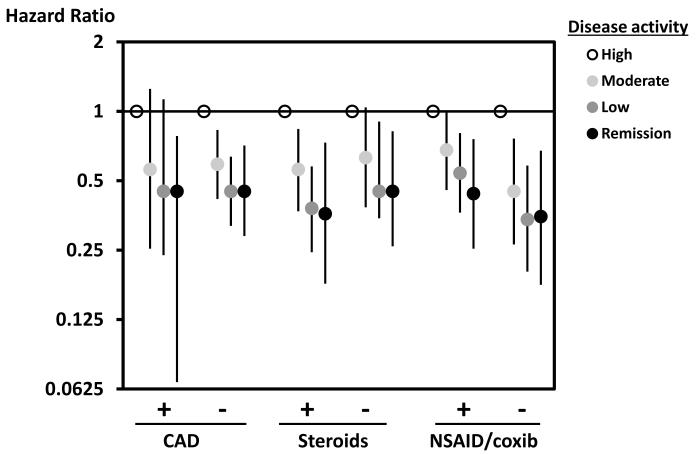
Figure 3.
This figure shows the hazard ratios for the subgroup analyses with the reference being high disease activity as measured by the Clinical Disease Activity Index. All hazard ratios are from Cox proportional hazard Model C which is adjusted for age, gender, age*gender interaction, and cardiovascular risk factors (prior MI, presence of CAD, diabetes, hypertension, hyperlipidemia, smoking, BMI (continuous), family history of MI, aspirin use, RA disease duration, and baseline use of NSAIDs or selective COX-2 inhibitors, corticosteroids, disease modifying anti-rheumatic drugs, and biologic drugs.

