Figure 2.
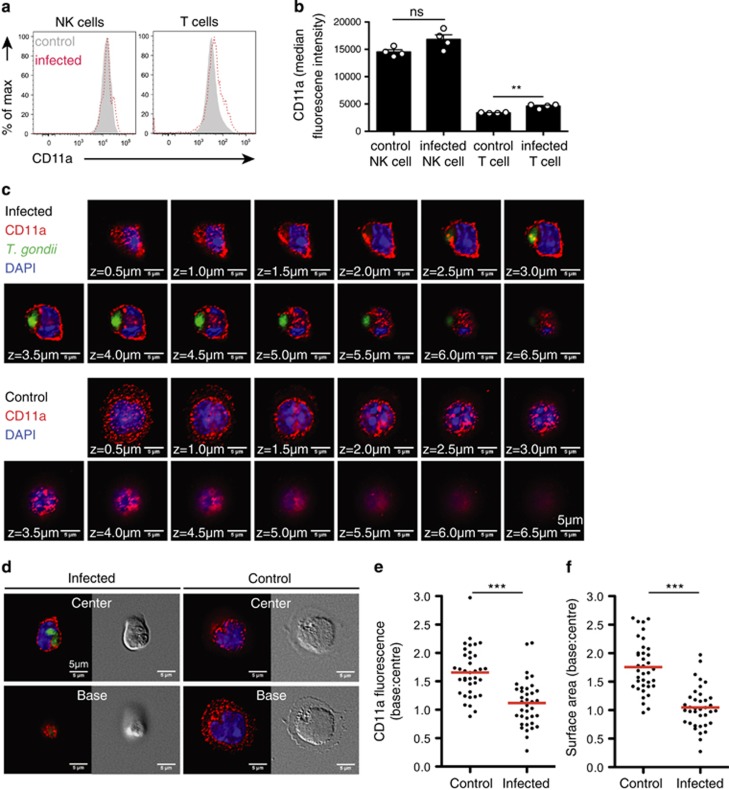
Infected NK cells display impaired integrin clustering and cell spreading. (a) Flow cytometric analysis of CD11a expression on NK cells in mesenteric lymph nodes at day 5 following oral infection is shown. Plots are derived from concatenated samples from four individual mice analyzed. Infected NK cells are shown in red and bystander NK cells in gray. (b) Graph shows the median fluorescence intensity of CD11a on the indicated cell populations (mean±s.e.m. of four mice). (c and d) Immunofluorescence analysis of CD11a distribution on the NK cell surface in response to ICAM-1 ligand. Uninfected and T. gondii-infected NK cells were settled onto immobilized mouse ICAM-1/Fc. After 15–30 mins, samples were fixed and stained to detect surface CD11a by fluorescence microscopy. Z-sections from the cell base to the cell top were acquired at intervals of 0.5 μm. Representative fluorescent and differential interference contrast micrographs from three independent experiments are shown. CD11a is shown in red, the parasites in green and the nuclei in blue. Corresponds to Supplementary Movie 2. (e and f) Differences in CD11a distribution and surface area between uninfected and infected cells were quantified as ratios of their respective values at the cell base to the cell center (nuninfected=37, ninfected=37 cells, from three independent experiments). Red bars show the mean.

