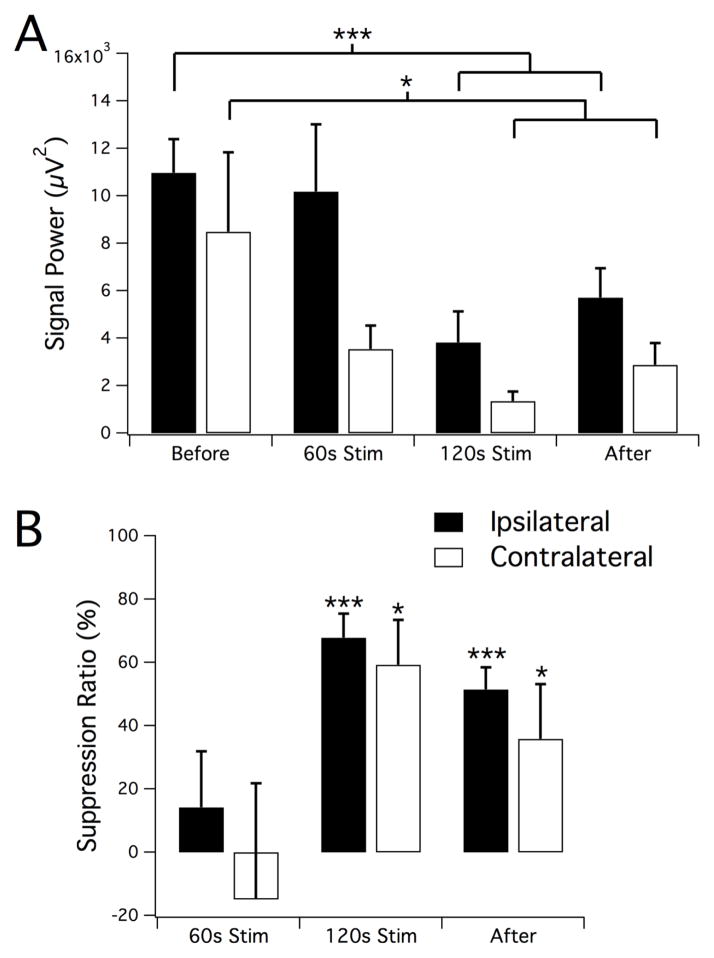
Figure 2.
Reduction of ictal activity in response to oLFS. Signal power (A) and calculated suppression ratio (B) from ipsilateral and contralateral recordings in the intervals before, during, and after the optical stimulation period. A significant reduction in seizure activity was observed during the second minute of stimulation as well as an after-effect of continued suppression of activity in the ipsilateral location. Results are the mean ± SEM, n=7, *P<0.05, ***P<0.001, paired t-test.

