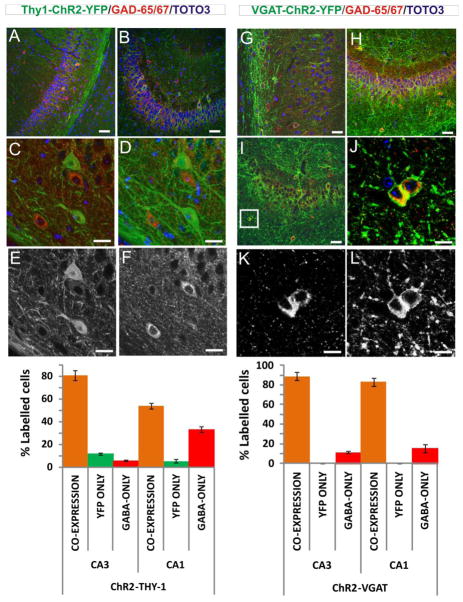
Figure 5.
Immunostaining and cell count summary for GABA interneurons in Thy1- and VGAT-ChR2-YFP hippocampal sections.
(A) Thy1-ChR2-YFP mouse (P14), panoramic view of CA1 showing two cells in the pyramidal cell layer co-expressing YFP and GAD-65/67 markers, which indicates that are GABA cells positive for ChR2. Note that some cells off the pyramidal cell layer only express GAD-65/67. Scale Bar 50 μm.
(B) Thy1-ChR2-YFP adult mouse (P100), panoramic view of CA3 showing that most cells expressing YFP also express GAD-65/67. Scale Bar 50 μm.
(C) Thy1-ChR2-YFP mouse (P100), example of two pyramidal cells expressing YFP but not GAD-65/67. This shows that ChR2 in the Thy-1 line is also express in pyramidal (excitatory) cells, which do not stain for GAD-65/67. The image corresponds to a single plane picture. Scale Bar 20 μm.
(D) Thy1-ChR2-YFP mouse, corresponding to a projection within 30 μm depth of the same image as in (C). Scale Bar 20 μm.
(E) Thy1-ChR2-YFP mouse, same image as in (C) in the green YFP channel showing pyramidal cells positive to YFP. Scale Bar 20 μm.
(F) Thy1-ChR2-YFP mouse, same image as in (C) in the red GAD-65/67 channel showing GABA cells positive to GAD-65/67. Scale Bar 20 μm.
(G) VGAT-ChR2-YFP mouse (P14), panoramic view of CA1 showing that most cells in the pyramidal cell layer co-expressing YFP and GAD-65/67 markers, which indicates that are GABA interneurons positive for ChR2. Scale Bar 50 μm.
(H) VGAT-ChR2-YFP mouse (P14), panoramic view of CA3 showing that most cells in the pyramidal cell layer co-expressing YFP and GAD-65/67 markers, which indicates that are GABA interneurons positive for ChR2. Scale Bar 50 μm.
(I) VGAT-ChR2-YFP mouse (P100), panoramic view of CA3 showing that most cells in the pyramidal cell layer co-expressing YFP and GAD-65/67 markers. Scale Bar 50 μm. The image includes a square area that was selected for enlargement in (H).
(J) VGAT-ChR2-YFP mouse, magnified view of two cells co-expressing YFP and GAD-65/67. Scale Bar 20 μm
(K) VGAT-ChR2-YFP mouse, same as (I) for red GAD-65/67 channel. Scale Bar 20 μm.
(L) VGAT-ChR2-YFP mouse, same as (J) for green YFP channel. Scale Bar 20 μm.

