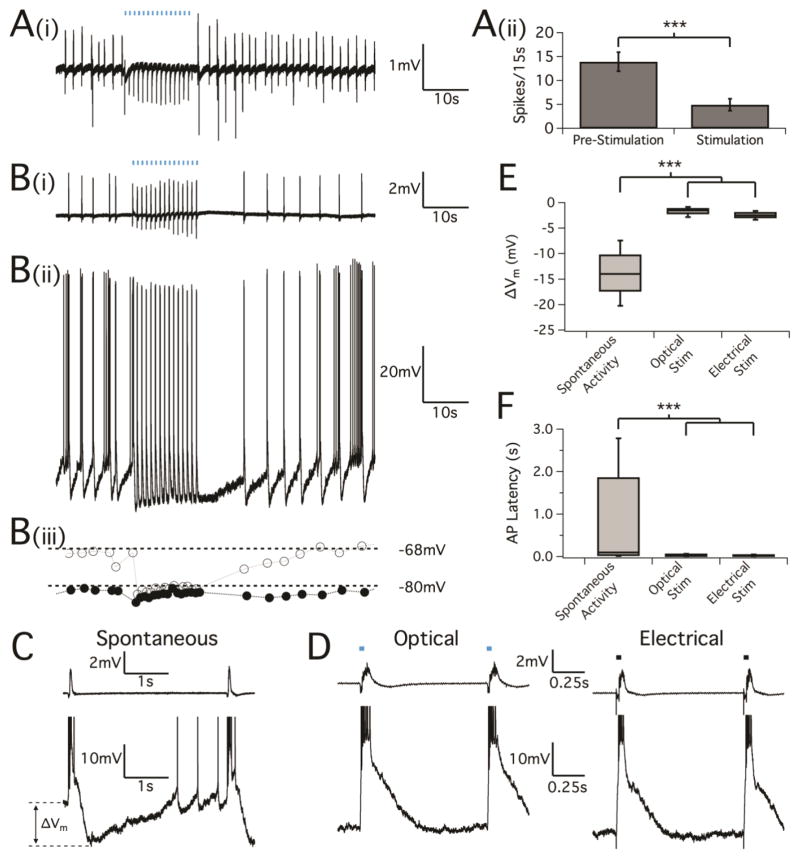
Figure 6.
LFS entrainment of interictal bursting by GABAA activation from optical stimulation. Transverse hippocampal slices undergoing spontaneous interictal bursting were stimulated with optical pulses at a frequency of 1Hz. (A, i) Field potential recordings in CA3 of adult mice (P90) showing neural activity was evoked by optical stimulation and (A, ii) caused the reduction of inter-ictal spiking (p<0.001, paired t test, n=18). (B, i) Field potential recordings in CA3 of juvenile mice (P14-16) showing neural activity followed by optically-evoked potentials which is similar to what has shown in adult mice. (B, ii) Corresponding intracellular activity using sharp electrodes from a nearby CA3 pyramidal cell. Blue bars indicate optical pulses (10ms). Note that the length of the stimulus bars is not to scale. (B, iii) Plot of the voltage immediately preceding a bursting event (gray open circles) together with the minimum voltage between events (black circles). (C) Cellular behavior as recorded by sharp electrodes during spontaneous inter-ictal activity showing a burst of action potentials that corresponds to the field potential event, followed by a hyperpolarization and gradual return to the resting membrane potential before the next spontaneous burst. As the cell depolarizes back to rest, spontaneous action potentials often precede the next epileptiform burst. (D) Cellular behavior during oLFS (left) and electrical LFS applied to the mossy fibers (right). Blue and black bars (again not to scale) indicate the optical and electrical stimuli, respectively. (E) Box-and-whisker plot of the change in membrane voltage induced by spontaneous and evoked bursting events. While the cell membrane potential varies widely during spontaneous inter-ictal activity, membrane voltage remained low in between evoked bursts during the stimulus periods. P<0.001, one-way ANOVA. (F) Box-and-whisker plots of AP spike timing after spontaneous and evoked bursting events. During low frequency stimulus periods were marked by a reduction of cellular inter-event action potential activity. P<0.001, Kolmogorov-Smirnov test of distributions.

