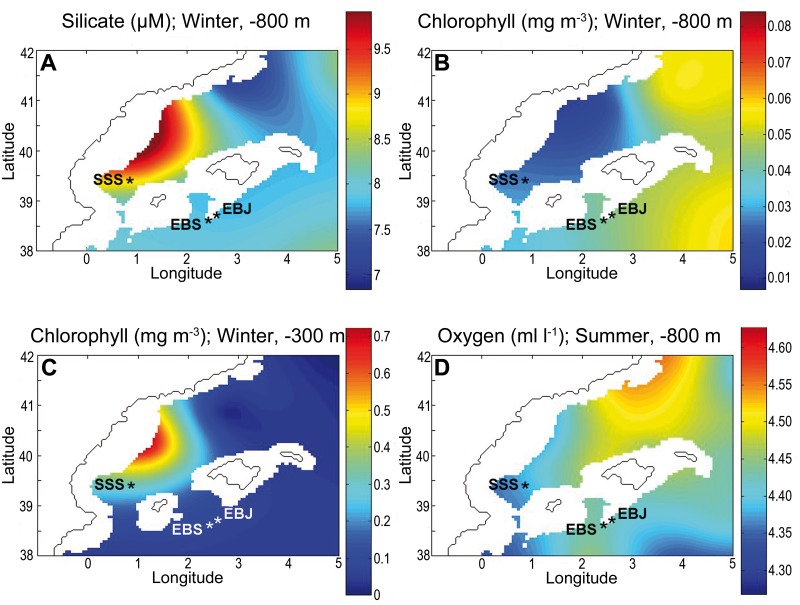
Fig 6. General oceanographic features.
(A) Silicate concentration (μM) at the -800 m isobath of the Balearic Sea. (B-C) Chlorophyll concentration (mg m-3) at the -800 m and -300 m isobaths; the latter one indicates the coastal origin of the sinking phytoplankton. (D) Oxygen concentration (ml l-1) at the -800 m isobath. To illustrate between-mountain comparisons in the various variables of interest, we are depicting only the spatial distribution during the season in which differences between the SSS area and the EBJ-EBS area were the greatest for each variable. In general, between seamount differences were very small over the year cycle, with the winter season causing the larger differences, except for oxygen concentration, which took place in summer.

