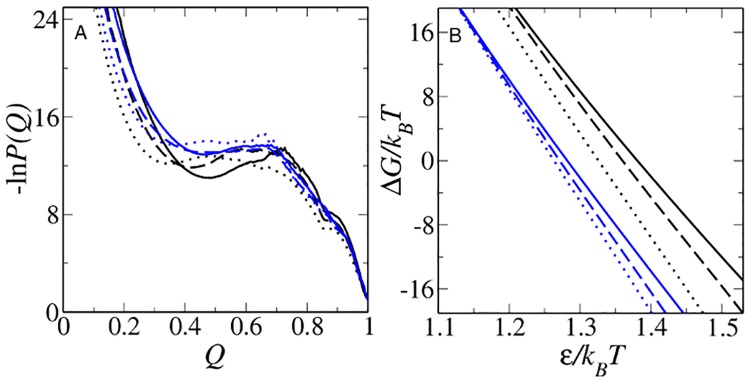
Fig 2. Modeling native stability changes.

(A) Simulated Im7 (black) and Im9 (blue) free energy profiles at ΔG/k B T values that equal to the experimental stabilities of the proteins at zero denaturant. (B) For all six models studied, ΔG/k B T varies approximately linearly with inverse temperature 1/T. Results for db, db+hϕ and db+MJhϕ in (A) and (B) are plotted using the line styles in Fig 1. The ΔG/k B T values here and in subsequent figures are computed by identifying conformations with Q ≤ Q D = 48/154, 57/154, and 61/154 as the Im7 unfolded states, respectively, in the db, db+hϕ and db+MJhϕ models; and conformations with Q ≥ Q N = 151/154 as the Im7 folded state in all three models. The corresponding criteria for the Im9 unfolded states are Q D = 50/164, 56/164, and 61/164; and the Im9 folded state is defined by Q N = 159/164 for all three models.
