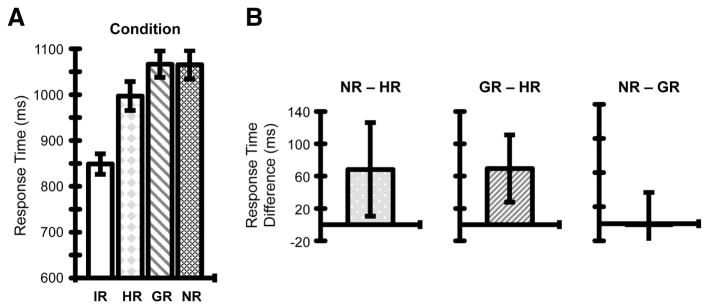
Figure 3. Probe response time results.

(A) Group mean RTs for probe events as a function of Condition. Error bars reflect mean standard errors. (B) Post-hoc pairwise comparisons revealed hand repetition priming, evident as the mean difference between RTs for NR – HR conditions (left), as well as GR – HR conditions (middle). Conversely, there was no reliable evidence for (hand-independent) grasp repetition priming, shown as the mean difference between RTs for NR – GR conditions (right), not statistically different from zero. For each of these post-hoc comparisons, error bars reflect 95% confidence intervals based on the standard errors of the respective mean difference scores across individuals, Bonferroni corrected.
