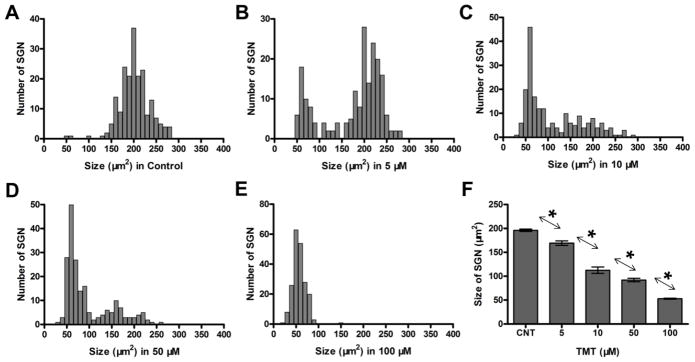
Figure 5.

Effect of TMT on SGN soma size. Distributions (n = 200 cells/group) of SGN soma size in control group (A) and cultures treated with TMT for 24 h; treatment/dose indicated below abscissa (B–E). (F) Mean (+/−SEM, n=200 cells) size of SGN soma in control cultures and cultures treated with various concentrations of TMT. Arrows/asterisks indicate significant between group differences (*p < 0.05).
