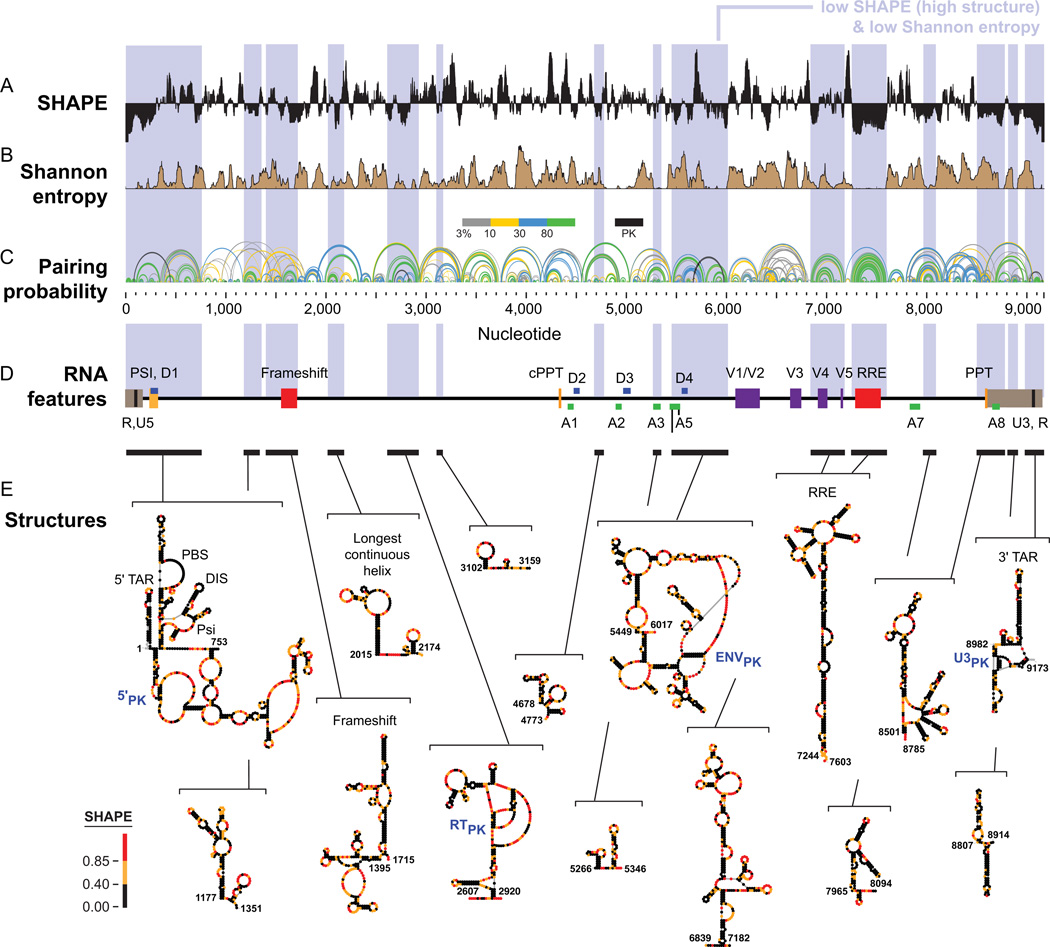
Figure 7.
SHAPE-MaP analysis of the HIV-1 RNA genome (NL4-3 strain). (A) SHAPE reactivities. Reactivities are shown as the centered 55-nt median window, relative to the global median. (B) Shannon entropies. (C) Pairing probabilities. Arcs representing base pairs are colored by their pairing probabilities, with green arcs indicating highly probable helices. Areas with overlapping arcs have multiple potential structures. Black arcs indicate pseudoknots (PK). (D) RNA regions with known biological functions. Bars and blue shading enclose low SHAPE (highly structured) and low Shannon entropy regions; these regions overlap with known RNA functional motifs much more frequently than expected by chance. (E) Secondary structure models for regions identified de novo. Names of known structures are given. Figure adapted from Ref. 26.

