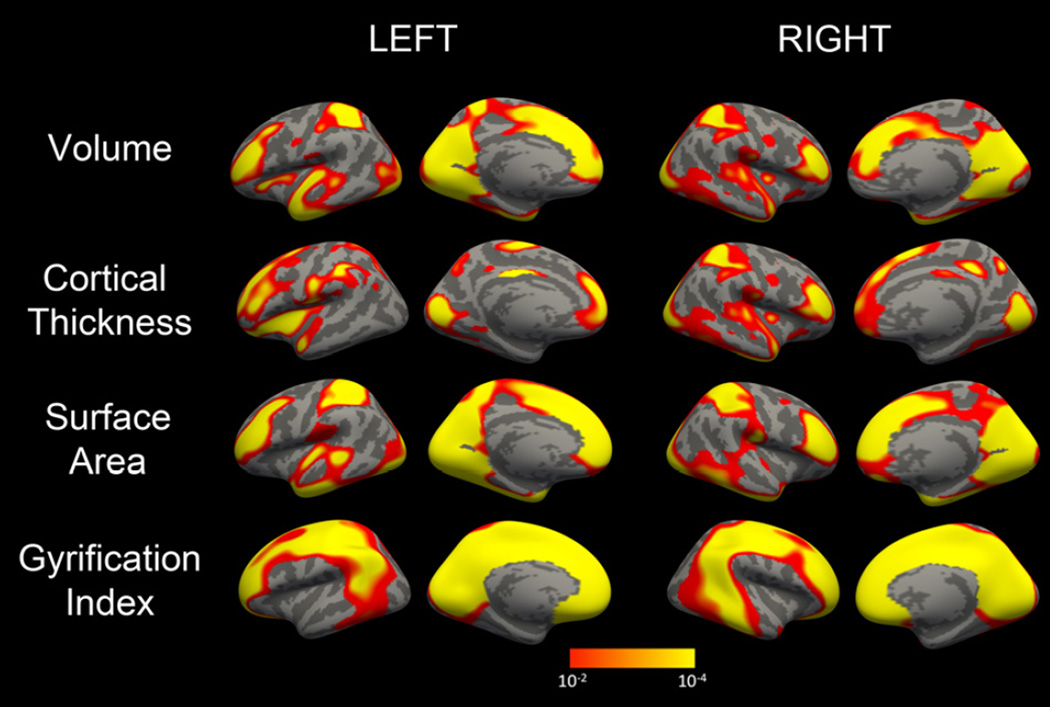
Figure 1.
Probability maps from 4-group ANOVA showing regional differences in cerebral volume (A), cortical thickness (B), surface area (C) and local gyrification index(D). Statistical maps for each hemisphere are first masked at pFDR=0.05 and then displayed at an uncorrected threshold of 1.3 < -log(p) <4 for consistency.

