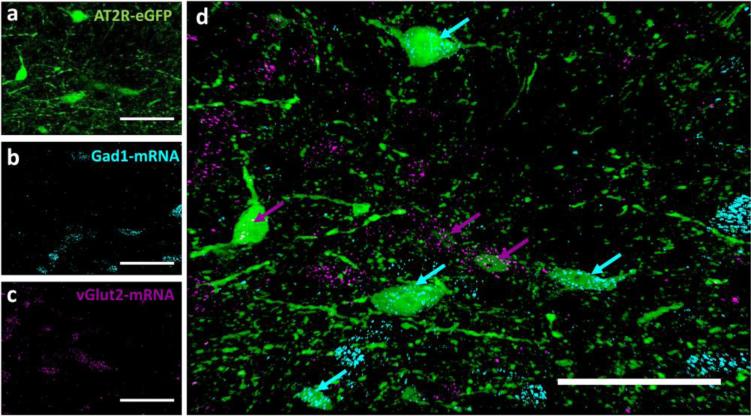
Fig. 9. Dual multiplex ISH for vGlut2 and Gad1 mRNA with AT2R-eGFP IHC in NTS.
High magnification projection images through the NTS (−7.76 mm caudal to bregma) of an AT2R-eGFP mouse depicting (a) eGFP immunoreactivity in green, (b) Gad1 mRNA ISH in cyan, (c) vGlut2 mRNA in magenta, and (d) the merged image. Scale bars = 50 μm.

