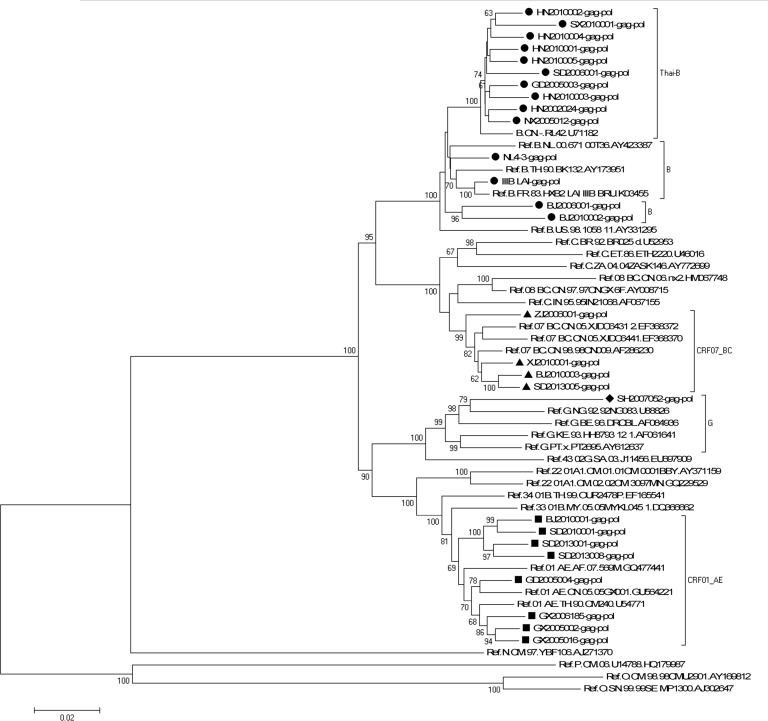
Fig 1. Phylogenetic analysis of characterized HIV-1 gag-pol gene sequences.
The tree was midpoint rooted. Horizontal branch lengths are drawn to scale (the scale bar represents 0.02 nucleotide substitution per site). Bracket separation is for clarity only. Numbers at the nodes indicate the bootstraps in which the cluster to the right was supported by 60% and higher. Markers in different shapes at the ends of the horizontal branch represent different subtypes to which the sequences belong. Triangle represents the subtype CRF07_BC, square represents the subtype CRF01_AE, rhombus represents the subtype G, and circle represents the subtype B (B represented by black round while Thai-B represented by dark red circle).

