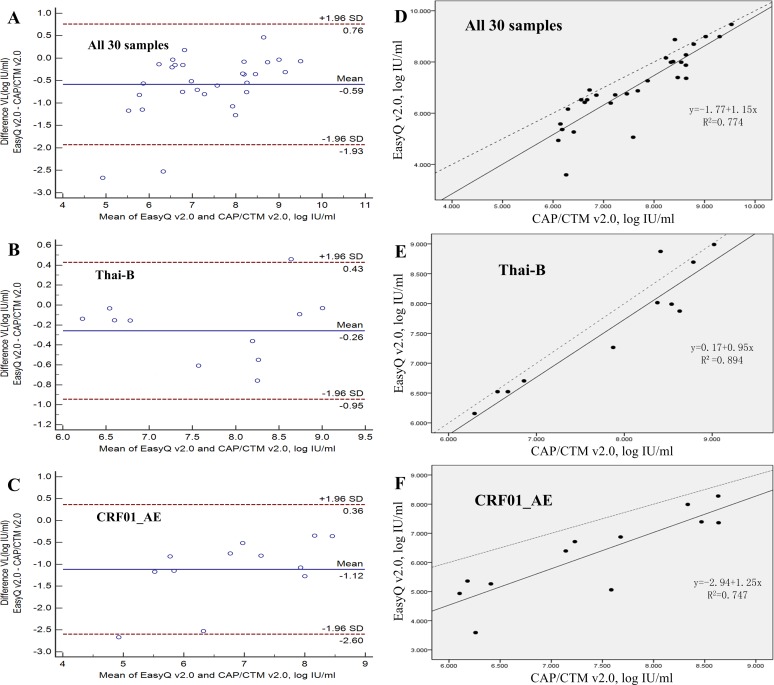
Fig 3. Agreement and linear relationship between the Cobas AmpliPrep/Cobas TaqMan HIV-1 test version 2.0 (CAP/CTM v2.0) and the NucliSens EasyQ HIV-1 version 2.0 (EasyQ v2.0) calculated using the Bland-Altman model.
(A) Agreement between EasyQ v2.0 and CAP/CTM v2.0 when used to measure all 30 samples in the panel. (B) Agreement between EasyQ v2.0 and CAP/CTM v2.0 when used to measure 11 clade Thai-B samples in the panel. (C) Agreement between EasyQ v2.0 and CAP/CTM v2.0 when used to measure 12 clade CRF01_AE samples in the panel. For A, B and C, solid horizontal lines indicate the mean values, and dashed horizontal lines indicate the +1.96SD and _1.96SD values. (D) The linear relationship between the CAP/CTM v2.0 and EasyQ v2.0 when used to measure all 30 samples. (E) The linear relationship between the CAP/CTM v2.0 and EasyQ v2.0 when used to measure 11 clade Thai-B samples. (F) The linear relationship between the CAP/CTM v2.0 and EasyQ v2.0 when used to measure 12 clade CRF01_AE samples. For D, E and F, solid line represents the fitted regression line and the dashed line represents the equality line.

