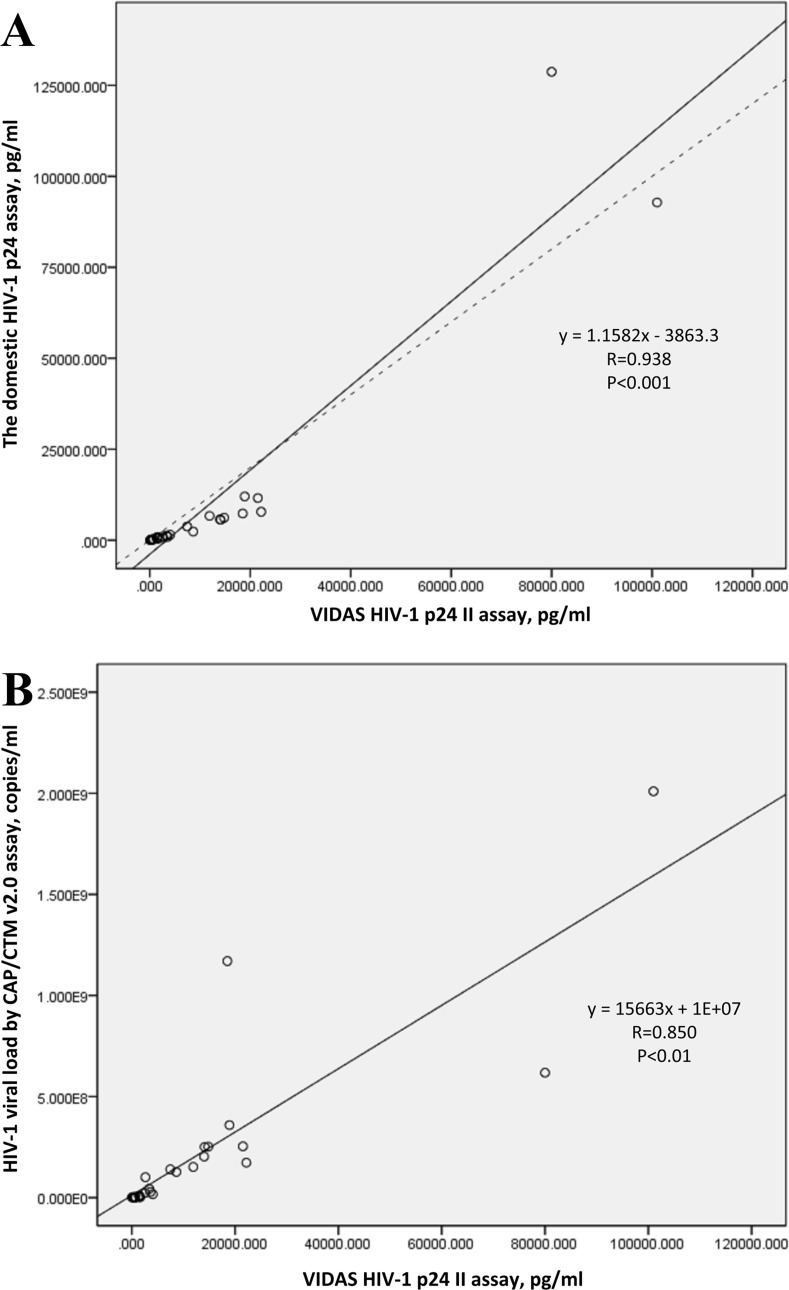
Fig 4. The linear relationship between the two assays of HIV-1 p24 measurement and the linear relationship between p24 antigen concentration and HIV-1 viral load based on the values of all 30 samples.
(A) The linear relationship between the BioMerieux VIDAS HIV p24 II assay and the domestic HIV-1 p24 assay when used to measure all 30 samples. Solid line represents the fitted regression line and the dashed line represents the equality line. (B) The linear relationship between HIV-1 p24 antigen concentration and viral load based on all 30 isolates, tested by BioMerieux VIDAS HIV p24 II and Roche COBAS Taqman version 2.0, respectively. Solid line represents the fitted regression line.

