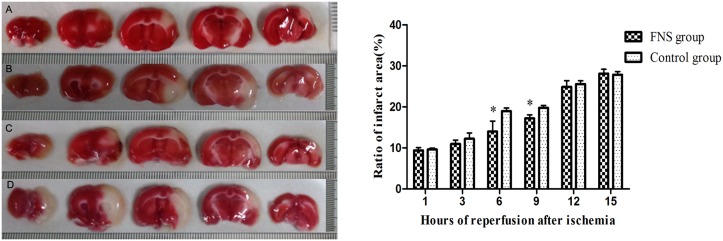
Fig 6. The measurement of infarct volume by TTC staining.
(A): the 6h FNS group; (B): the 6h control group; (C): the 9h FNS group; (D): the 9h control group. The infarct area was shown as white color, and FNS significantly reduced the infarct volume. Results are expressed as the mean ± SD. *p < 0.05, vs the control group, n = 5.

