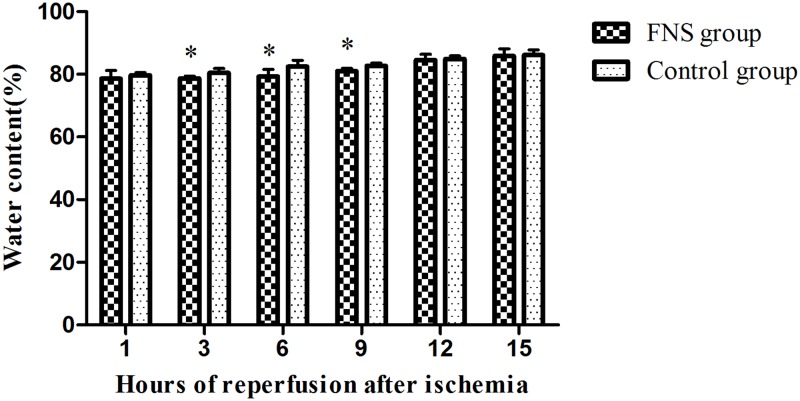
Fig 7. Brain water content of two groups.
(A) The percentage of ischemic lesion area was represented as the ratio of the infarction area to the whole slice area. (B)Water content was calculated by (wet weight −dry weight) /wet weight × 100%. Results are expressed as the mean ± SD. *p < 0.05, vs the control group, n = 5.

