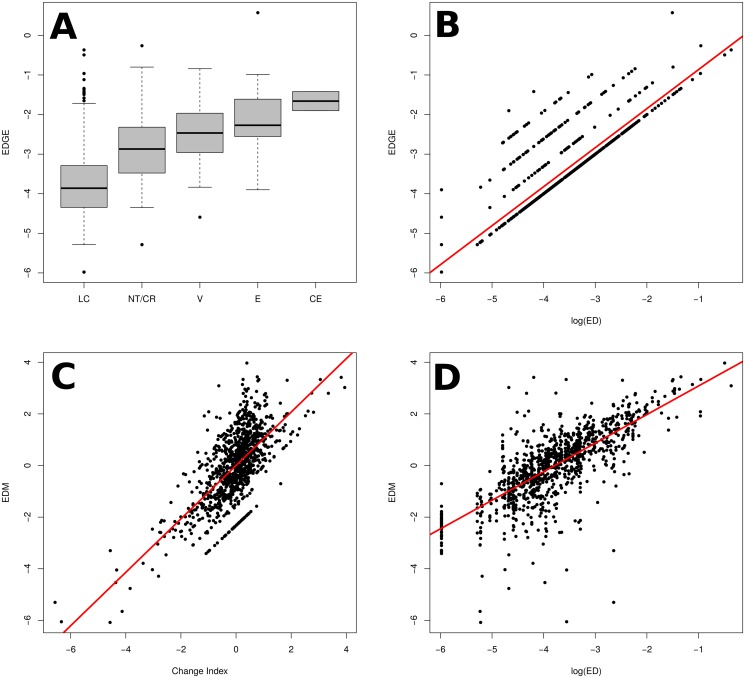
Fig 2. EDGE and EDM plotted against their components.
In (A) and (B), EDGE is plotted against Red List category (increasing in threat level from left-to-right; r 2 = 0.20) and the logarithm of evolutionary distinctiveness (r 2 = 0.78) respectively. The larger r 2 when regressed against log(ED) suggests EDGE is more strongly related to ED than GE. (C) and (D) show EDM against change index (r 2 = 0.47) and the logarithm of evolutionary distinctiveness (r 2 = 0.56) respectively. EDM is related almost equally strongly to its components, and so is less biased than EDGE. All models above were statistically significant (p < 0.0001) and were linear regressions, with the exception of comparison of EDGE and Red Lists status, which was an ANOVA. Note that EDM is calculated with scaled values, but is not regressed against them above.

