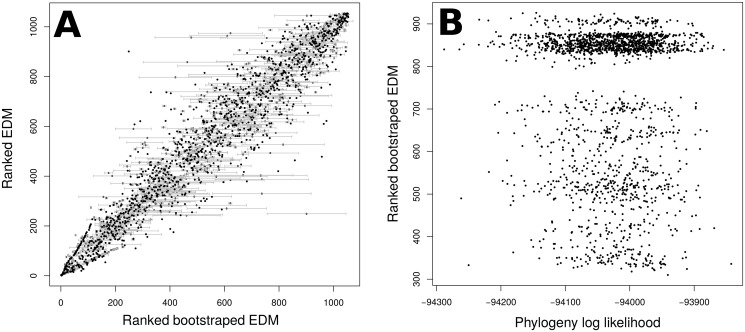
Fig 3. Variability of EDM values across bootstrap phylogenies.
In (A), the ranks of the best phylogeny’s EDM values are plotted against the median ranks across all the bootstrap phylogenies, with grey whiskers showing the standard deviations of those ranks. (B) plots the rank of EDM for Wahlenbergia hederacea in each bootstrap phylogeny against the log. likelihood of that phylogeny. Wahlenbergia hederacea is the species with the largest standard deviation in (A). Three distinct groupings of EDM values can be seen in (B), probably reflecting equally likely islands in treespace (see discussion).

