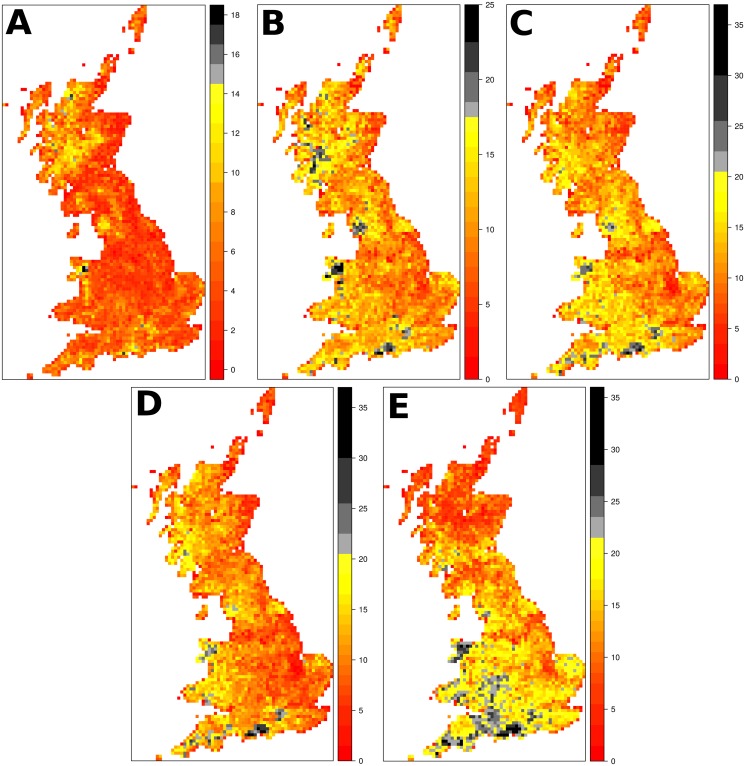
Fig 5. Distribution of top-fifty ranked species across Britain.
The sub-panels show EDGE (A), EDM (B), ED(AM)max (C), EDAM (D), and EDAM′ (E). Each map has a legend to the right hand side, splitting the counts of species into twenty ‘Jenks’ quantiles (classIntervals function in the R package classInt [58]). The greatest four quantiles have been coloured differently, to emphasise the high-priority sites.

