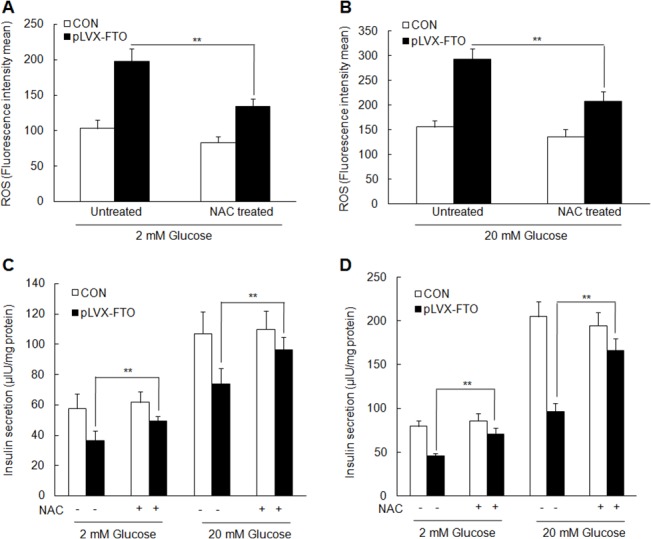
Fig 5. NAC treatment partially rescues the effect of FTO overexpression on the inhibiton of insulin secretion.

Detection of ROS production in MIN6 with overexpressed-FTO or empty vector with NAC treatment or not in the presence of 2 mM glucose (A) or 20 mM glucose (B). Detection of insulin secretion with NAC treatment or not at 10 min (C) or 60 min (D) after the stimulation of 2 mM or 20 mM glucose. Data were presented as mean ± SD. The symbol* and ** denotes statistical difference p < 0.05 and p < 0.01, respectively.
