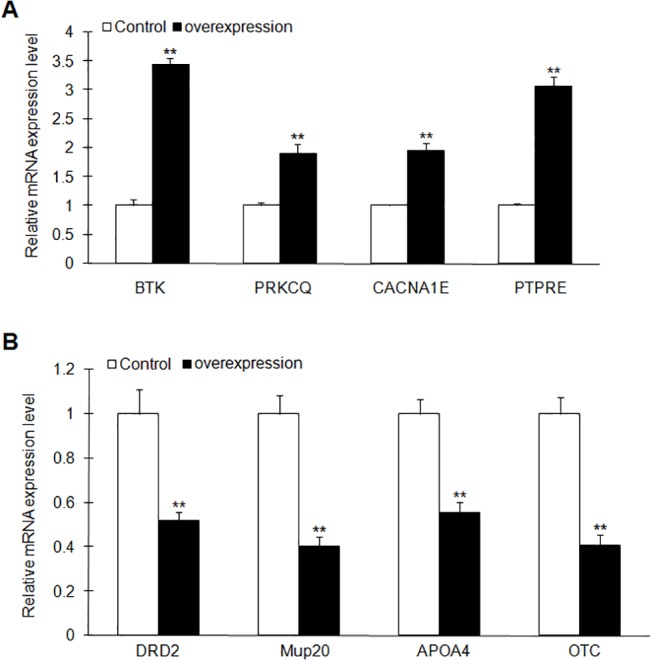
Fig 8. Gene expression analysis by Real-time PCR.

The expression of genes modulated by FTO overexpression was verified using qPCR. (A) Expression analysis of the upregulated genes in the microarray. (B) Expression analysis of the downregulated genes in the microarray. These genes are related to NF-κB signaling, metabolism and insulin secretion regulation. Data indicated mean ± SD. The symbol ** denotes statistical difference (p < 0.01).
