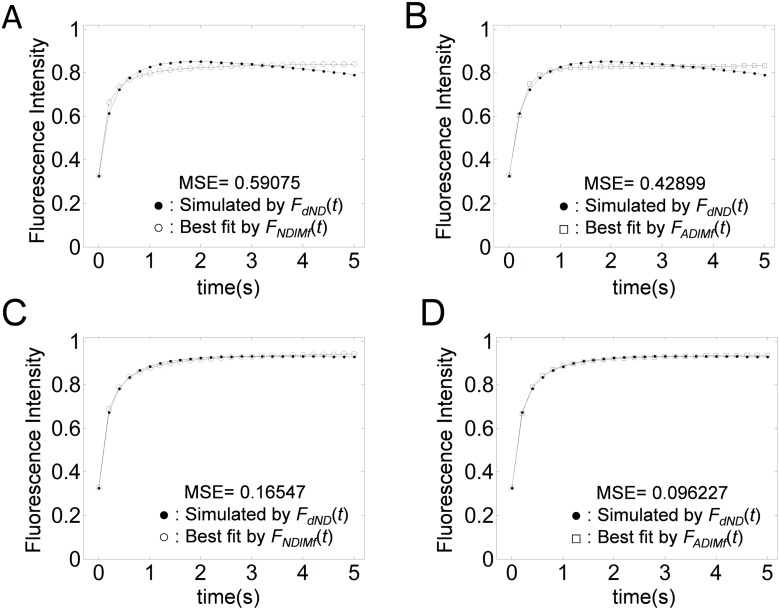
Fig 6. Effect of photofading during image acquisition on fits to FRAP curves for normal diffusion versus anomalous diffusion.
FRAP data with photofading (•) were simulated using f dADaMf(t) (Eq 42) assuming either a photofading rate of κ = 0.04 s−1 (A,B) or κ = 0.01 s−1 (C,D) under the conditions D = 1μm2/s, F 0 = 0.2, M f = 0.8, r n = 0.2 μm, and r e = 1 μm. The simulated curve was next fitted by f NDaMf(t) (Eq 37) (A,C) or f NDaMf(t) (Eq 37) (B,D). The resulting best fitting parameters were D = 2.1μm2/s and M f = 0.83 in (A), and M f = 0.83 in (B), D = 2.7μm2/s and M f = 0.95 in (C), and and M f = 0.94 in (D).

