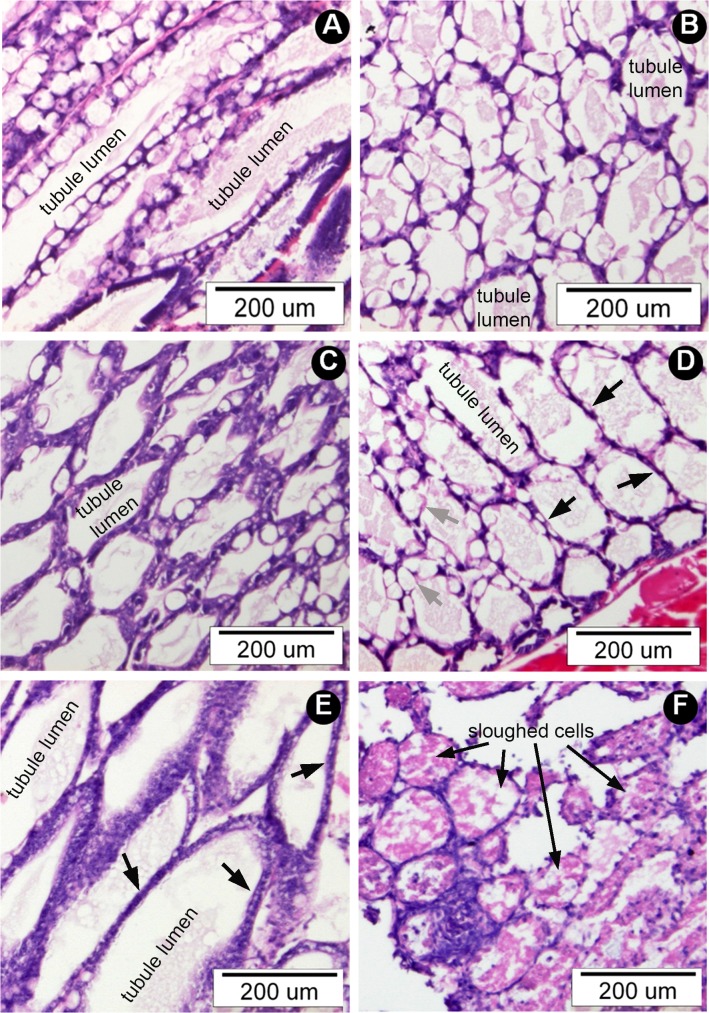
Fig 5. Examples of HP histology of moribund shrimp administered single or combined doses of ToxA and ToxB by reverse gavage.
(A) Tissue sections from a BSA (10/20 μg/g) negative control shrimp (tubule longitudinal sections) and (B) a ToxA (5 μg/g) treated shrimp (tubule cross sections) showing only normal histology with morphology and cell types as described in Fig 1A to 1C. (C) ToxB only (5 μg/g) and (D) ToxA+ToxB (2 μg/g each) showing mostly normal histology, but with some thin HP tubule epithelia (black arrows) when compared to epithelia of normal thickness (grey arrows). (E) ToxA+ToxB (5 g/g each) showing enlarged HP tubules (compared to A-C) with collapsed epithelia (black arrows) but no cell sloughing. (F) ToxA+ToxB (10 μg/g each) showing massive sloughing (black arrows) and dissolution of HP tubule epithelial cells (i.e., severe AHPND histopathology).

