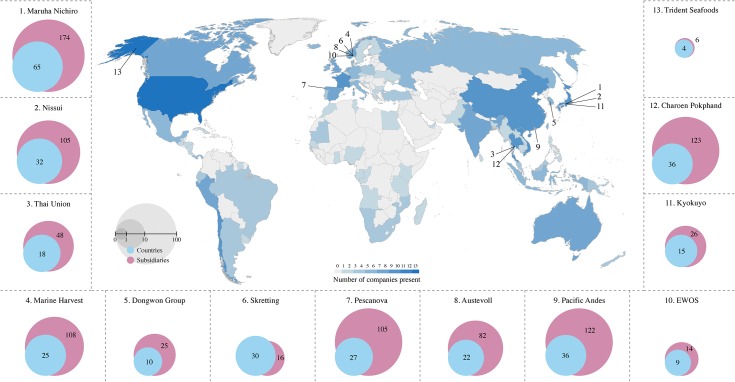
Fig 2. Global networks of operations.
Heat map illustrating the number of keystone actors operating in each country and the respective number of countries in which each company operates (blue circles) as well as the total number of subsidiaries of that company (purple circles). Company headquarters locations are indicated by the corresponding numbers on the map.

