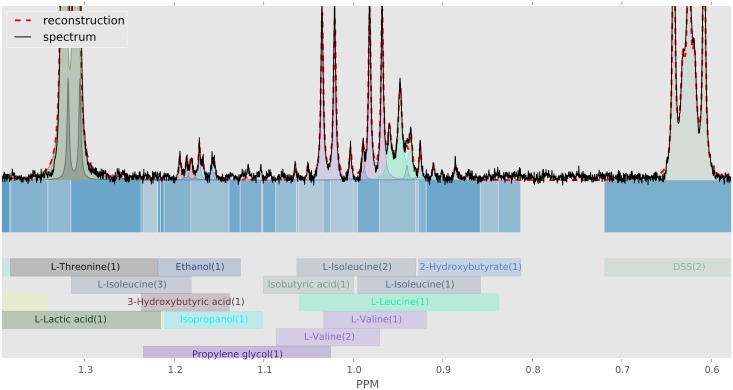
Fig 3. Construction of spectral regions.
Partitioning of spectrum  into continuous blocks
  . Here each block is shown with a different shade of blue, below the horizontal axis. The domain of influence of each cluster is also indicated with coloured blocks, where each cluster assumes the same colour in reconstruction of the spectrum (above horizontal axis).

