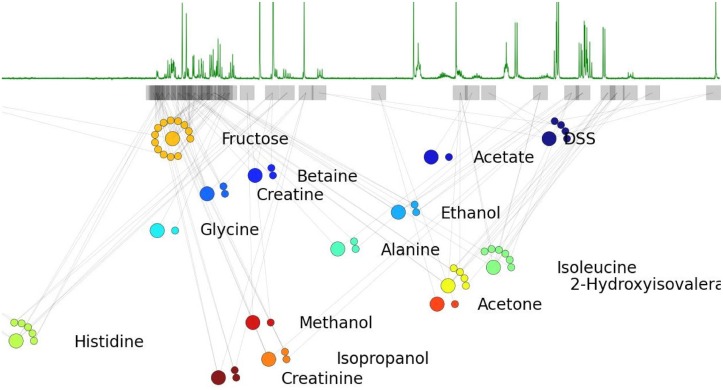
Fig 4. The factor-graph associated with a simple NMR spectrum.
The factor-graph for a library of 15 compounds is shown immediately below an associated NMR spectrum. Each factor is represented by a square and each variable using a circle. Concentration (larger circles) and shift variables (smaller circles, beside the associated concentration) corresponding to each compound appear together. The position of each factor position in the plot corresponds to the center of the corresponding block  .
.

