
Figure 6.
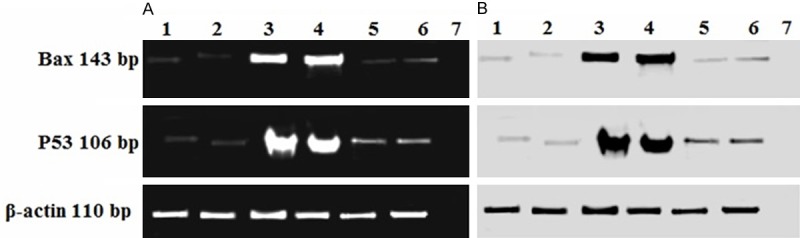
Expression of Bax and p53 mRNA in the left ventricle. The RT-PCR products obtained from all groups were separated by 2% agarose gel electrophoresis with 100 ng/ml ethidium bromide. 1: Control, 2: Sham operated, 3: MI model group, 4: MI then RES, 5: CoQ10 then MI, 6: CoQ10 and RES then MI and 7: Negative control. (B) Negative exposure of (A).