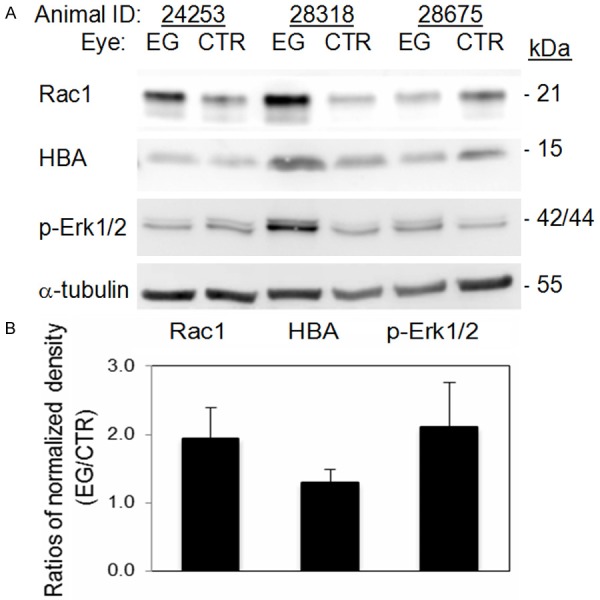
Figure 2.

Western blot analysis for Rac 1, HBA and Phosphorylated Erk1/2 (p-Erk1/2). Western blot analysis was performed on protein extracts from the same retinas that were analyzed with quantitative MS. Antibodies against Rac-1 and p-Erk1/2, respectively, were obtained from Cell Signaling, and anti-HBA from Chemicon. HRP-conjugated goat anti-rabbit IgG and goat anti-chicken IgY antibodies were from Santa Cruz and Abcam, respectively. Analysis for α tubulin (antibody from Santa Cruz) was also performed on the same blots as a loading control. A. Images of Western blotting. B. Fold differences in band densities between EG and control (CTR) eyes. Densities of appropriate protein bands in A, after first normalized with that of α tubulin, were compared between EG and control eyes. Due to the limited sample size (n = 3), the differences between EG and control eyes were not statistically significant, but with a clear trend of increase in EG eyes. p = 0.118, 0.165 and 0.202 for Rac1, p-Erk1 and HBA, respectively.
