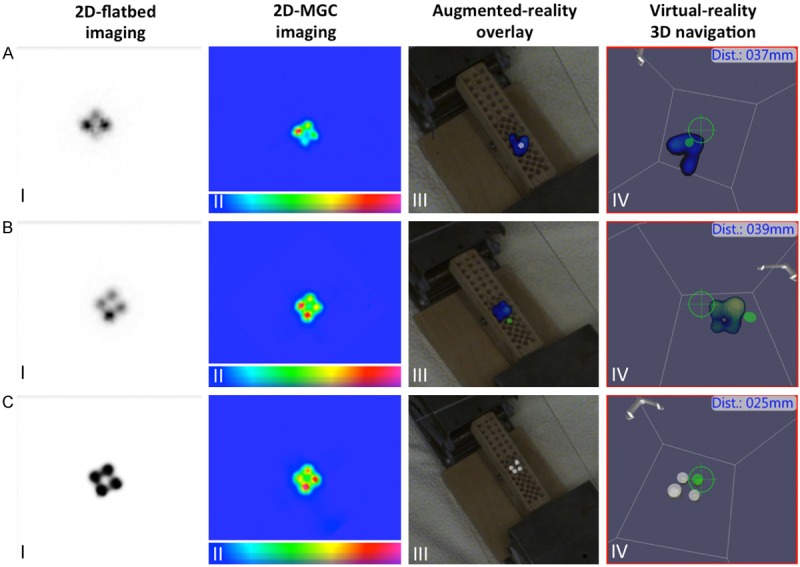
Figure 6.

Cluster node resolvability. A. Four 99mTc-pertechnetate sources of 0.5 MBq placed at 10 mm center-to-center distance from each other. B. Four 99mTc-pertechnetate sources of 1 MBq placed at 10 mm center-to-center distance from each other. C. Four 99mTc-pertechnetate sources of 25 MBq placed 10 mm center-to-center distance from each other. The images show: I) 2D-flatbed imaging; II) 2D-mobile gamma camera (MGC) image; III) 3D-freehandSPECT-mobile gamma camera (3D-FHS-MGC) augmented-reality overlay; and IV) virtual-reality navigation to the hotspots. 2D-flatbed, 2D-MGC and 3D-FHS-MGC were only able to separately visualize (and navigate) the 4×25 MBq 99mTc-pertechentate sources. In the scale bars, a blue color represents a low signal intensity and a red color represents a high signal intensity.
