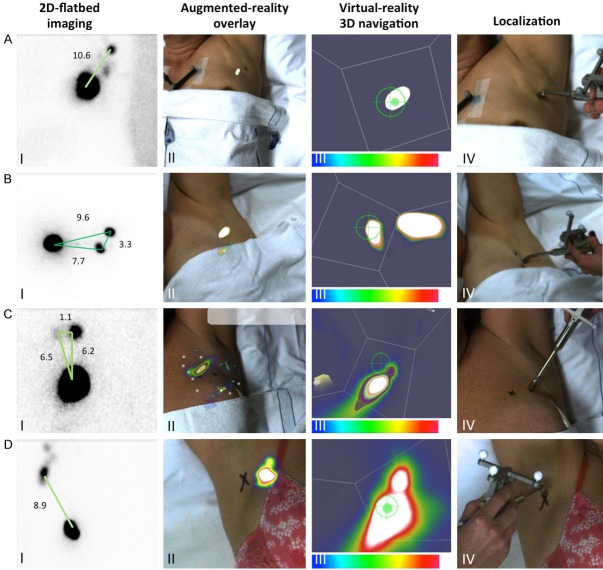
Figure 7.
Clinical sentinel node resolvability. A. Patient presenting with a solitary SN in the axilla. I) 2D-flatbed image showing a clear SN. II) 3D-FHS-MGC overlay showing the same SN in the axilla. III) 3D navigation pointing towards the SN in the axilla. IV) Localization of the SN in the axilla. B. Patient with two axillary SNs located 11 mm apart from each other. I) 2D-flatbed imaging showing an intense and a weak hotspot in the axilla. II) 3D-FHS-MGC overlay shows one elongated hotspot. III) 3D navigation shows the same elongated hotspot. IV) Localization points to a spot between the two spots marked by the nuclear medicine physician. C. Patient presenting with an intra-mammary and an axillary SN located at 33mm from each other. I) 2D-flatbed imaging clearly identified two SNs. II) 3D-FHS-MGC overlay also shows two SNs. III) 3D navigation points towards both SNs separately. IV) Successful localization of both SNs. D. Patient with a cluster of 2-4SNs in the axilla. I) 2D-flatbed image showing one hotspot. II) 3D-FHS-MGC shows a hotspot with a protrusion to one side indicating a cluster of SNs. III) 3D navigation shows the protrusion more clearly. IV) Localization points towards the center of the hotspot. In the scale bars, a blue color represents a low signal intensity and a white color represents a high signal intensity.

