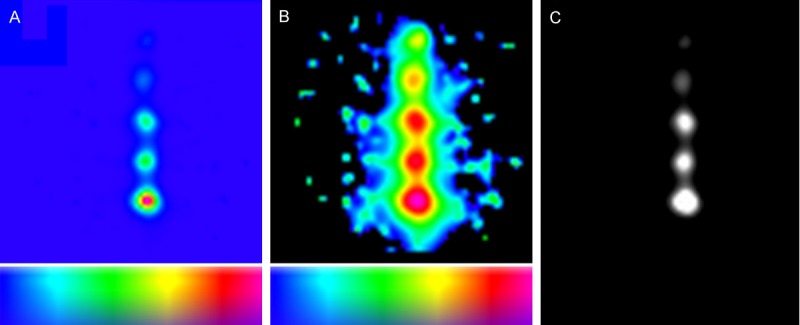
Figure 8.

Improved reconstruction algorithms help improve the data that is shown in the 3D-freehandSPECT-mobile gamma camera image. The images show an example of test setup 2 of the sensitivity experiment at a source-detector depth of 24 mm. A. Summation of volume data in z-direction when a linear transfer function is used. This data is currently displayed by the declipseSPECT system after reconstruction of the 3D-freehandSPECT-mobile gamma camera (3D-FHS-MGC) scan. B. Summation of volume data in z-direction when a logarithmic transfer function is used. Clearly in this setting more information is displayed than in A. C. A single volume slice from test setup 2. In Osirix medical imaging software (Pixmeo) the logarithmic transfer function is shown with the window leveling set to display all hotspots. In the scale bars, a blue color represents a low signal intensity and a red color represents a high signal intensity.
