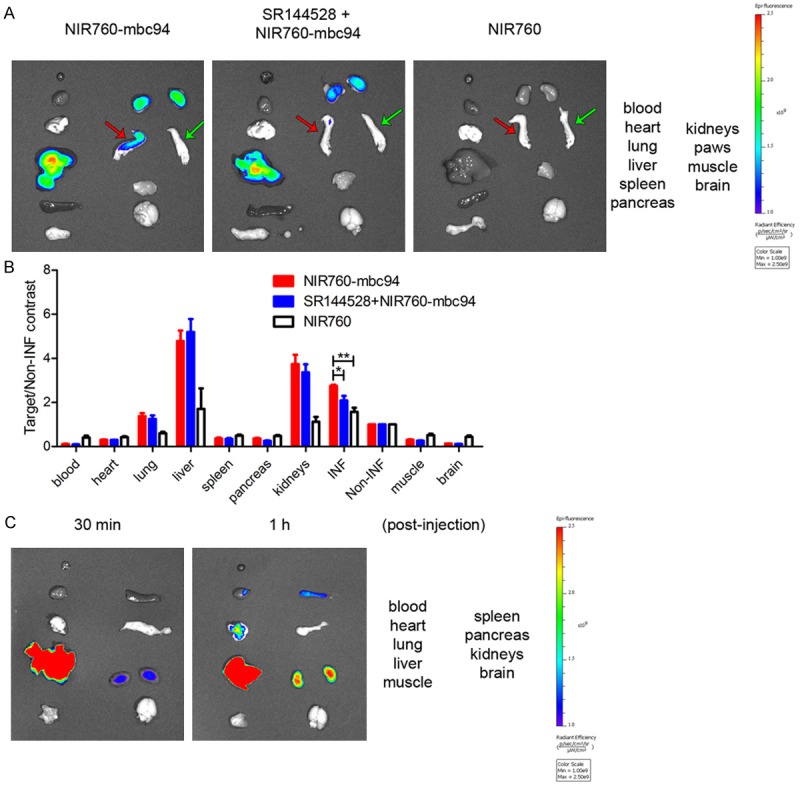
Figure 7.

Ex vivo inflammation imaging. A. Ex vivo imaging of tissues and organs after 48 h post injection of probes. The red arrow points to INF paw, and the green arrow points to the Non-INF paw. B. Quantitative analysis of fluorescence intensity contrast of tissues and organs over Non-INF paw. C. Ex vivo study on normal nude mice at 30 min and 1 h post i.v. injection of NIR760-mbc94.
