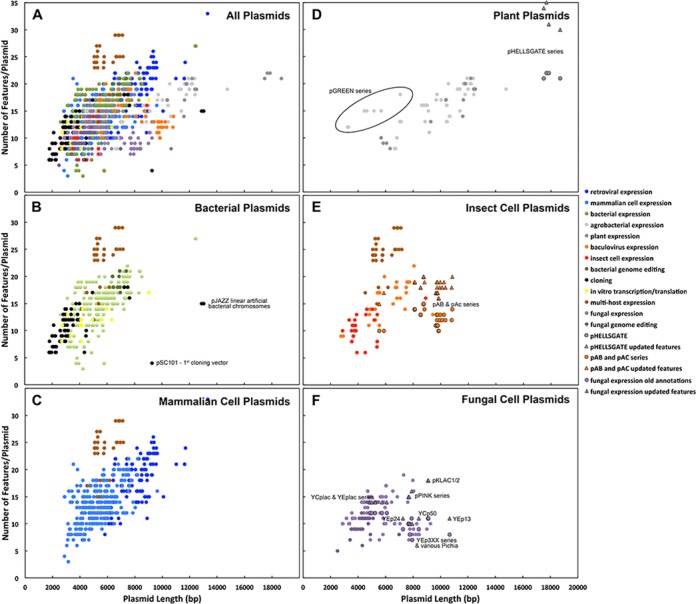
Figure 1.

Correlation between plasmid length and number of features per plasmid. (A) All plasmids. Types of plasmid are indicated by color in the figure legends. Panels (B)–(F) are grouped by lab host with the specific type of plasmid indicated in color as in panel (A). Outliers with low or high feature densities are labeled. The outlined data points denote plasmids that had three or more additional features detected by SnapGene that were not annotated in the original downloaded files. The outlined circles show the original feature densities for these plasmids and the outlined triangles show the updated feature densities.
