
Figure 3.
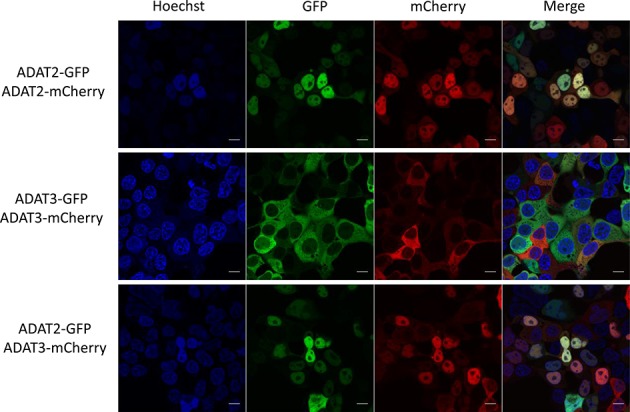
Live imaging confocal microscopy of HEK293T cells after co-expression of GFP- or mCherry-tagged HsADAT2 and HsADAT3 proteins. Scale bar corresponds to 10 μm. Shown are the results for C-term tagged ADAT proteins (see also Supplementary Figure S7).