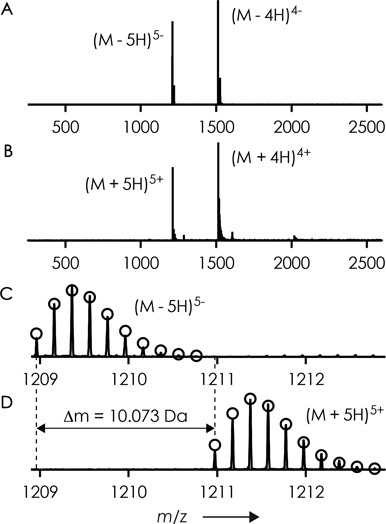
Figure 1.

Mass spectra of RNA 1 (2 μM) in 9:1 H2O/CH3OH with 20 mM CH3COONH4 as additive electrosprayed in (A) negative and (B) positive ion mode; (C) and (D) show measured (lines) and calculated (circles) isotopic profiles for (M-5H)5− and (M+5H)5+ ions, respectively.
