
Figure 5.
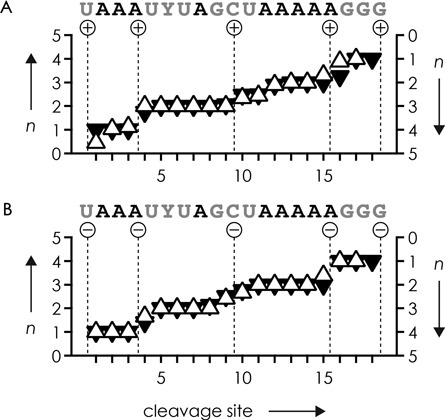
Average charge n of c (filled triangles, left axis) and y (open triangles, right axis) fragment ions from CAD of (a) (M+5H)5+ and b) (M−5H)5− ions of RNA 3 versus cleavage site using (a) 50 eV and (b) 70 eV laboratory frame collision energy; dashed lines indicate calculated charge locations (see the supplementary material).