
Figure 8.
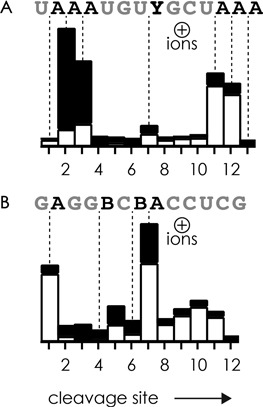
Relative abundances of c (black bars) and y (white bars) fragment ions from CAD of (M+4H)4+ ions of (A) RNA 9 and (B) RNA 10 versus cleavage site, using (A) 48 eV and (B) 44 eV laboratory frame collision energies; dashed lines indicate backbone cleavage sites on the 5′-side of adenosine (A), nebularine (B), and 2-aminopurine (Y) residues.