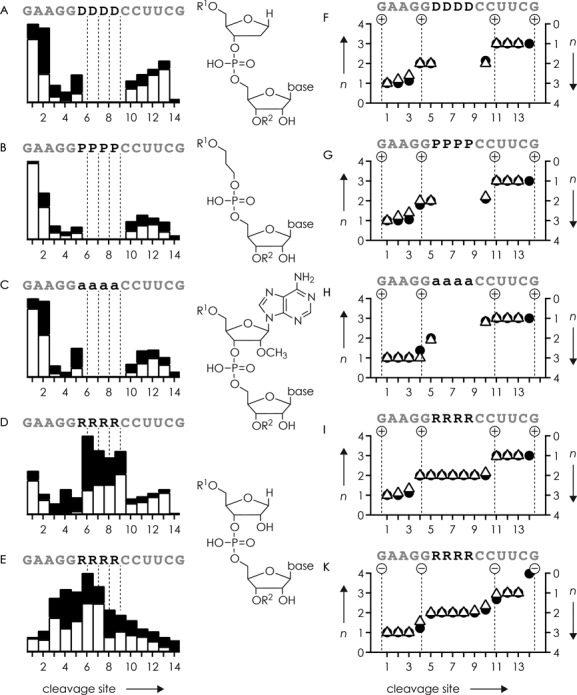
Figure 9.

Relative abundances of c (black bars) and y (white bars) fragment ions from CAD of (M+4H)4+ ions of RNA (A) 11, (B) 12, (C) 14, (D) 13 at 44 eV laboratory frame collision energy and (E) (M−4H)4− ions of RNA 13 at 64 eV versus cleavage site; dashed lines indicate backbone cleavage sites on the 3′-side of D, P, a, and R residues; average charge n of c (circles, left axis) and y (triangles, right axis) fragment ions from CAD of (M+4H)4+ ions of RNA (F) 11, (G) 12, (H) 14, (I) 13 and (K) (M−4H)4− ions of RNA 13 versus cleavage site; dashed lines in (F)–(K) indicate calculated charge locations (see the supplementary material).
