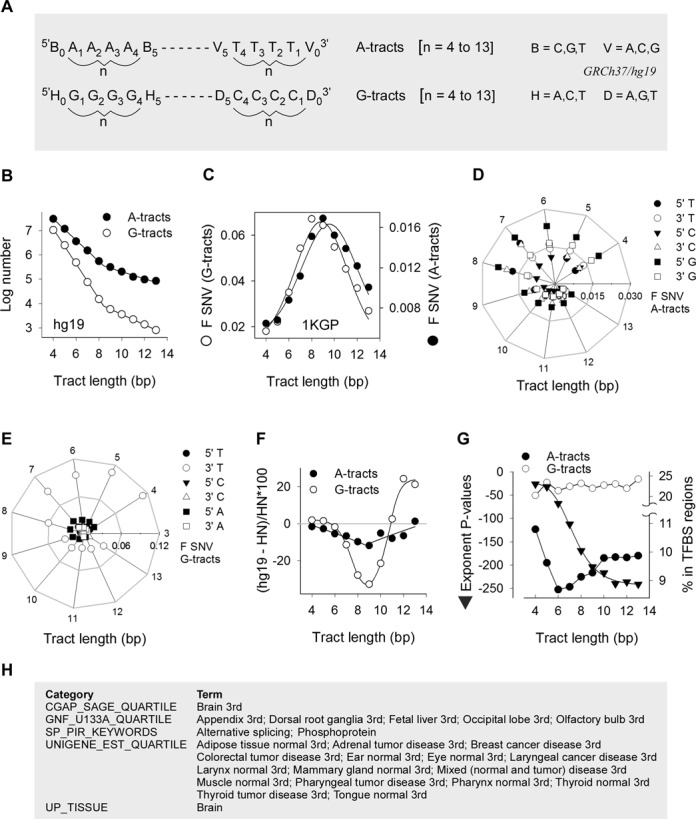
Figure 1.

Mononucleotide repeat variation, evolutionary conservation and association with transcription. (A) The search algorithm was designed to retrieve runs of As or Ts (A-tracts) and Gs or Cs (G-tracts) length n (n = 4 to 13), along with their 5′ (n = 0) and 3′ (n = n + 1) nearest neighbors from hg19. Tract bases were numbered 5′ to 3′ with respect to the purine-rich sequence. The panel exemplifies the nomenclature for A- and G-tracts of length 4. (B) Logarithmic plot of the number of A-tracts (closed circles) and G-tracts (open circles) in hg19 as a function of length. (C) Normalized fractions of polymorphic tracts (F SNV) (number of SNVs divided by both hg19 number of tracts and n) from the 1KGP for A-tracts (closed circles) and G-tracts (open circles). (D) Radial plot of SNVs in the 1KGP at the 5′ and 3′ nearest neighbors of A-tracts. Periphery, tract length; horizontal axis, scale for the fraction of SNVs (F SNV). (E) Radial plot of SNVs in the 1KGP at the 5′ and 3′ nearest neighbors of G-tracts. (F) Percent difference in the numbers of A-tracts (closed circles) and G-tracts (open circles) between syntenic regions of hg19 and HN genomes. (G) The exponents of Benjamini-corrected P-values for A-tract-containing genes enriched in transcription-factor binding sites plotted as a function of A-tract length (triangles); each value represents the median of the top 11 USCS_TFBS terms. The percent A-tracts (closed circles) and G-tracts (open circles) intersecting genomic regions pulled-down by chromatin immunoprecipitation using antibodies against transcription factors are plotted as a function of tract length. (H) List of gene enrichment terms with a Benjamini-corrected P-value of <0.05 in common between genes containing A- and G-tracts of lengths 4–13, excluding the UCSC_TFBS terms.
