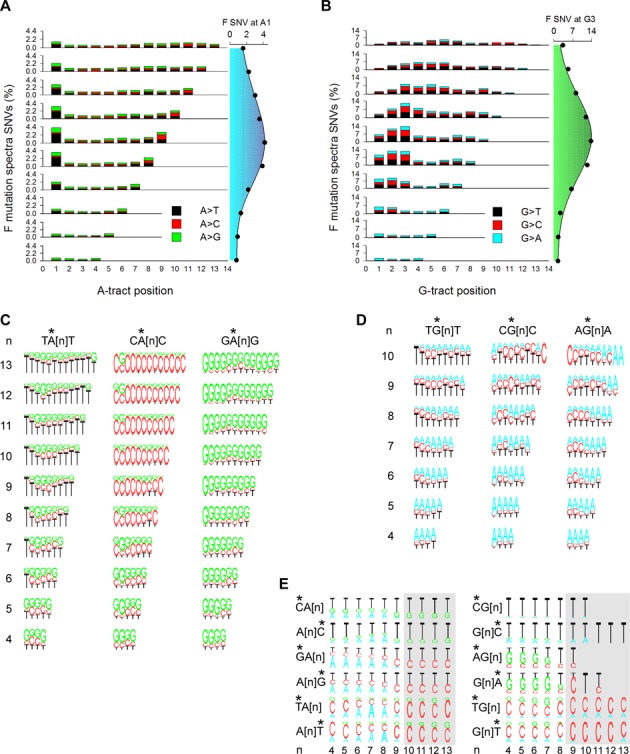
Figure 2.

Population variation spectra. (A) Variation spectra of A-tracts. Percent (number of SNVs at each position divided by the number of tracts in hg19 × 100) of A→T (black), A→C (red) and A→G (green) SNVs in the 1KGP dataset (left). Percent SNVs at A1 as a function of tract length (right). (B) Variation spectra of G-tracts. As in panel A with G→T (black), G→C (red) and G→A (cyan) (left). Percent SNVs at G3 as a function of tract length (right). (C) Percent A→T, A→C and A→G transitions at each position along A-tracts (stars) preceded and followed by a T (TA[n]T, left), C (CA[n]C), center) and G (GA[n]G, right) as a function of tract length. (D) Percent G→T, G→C and G→A transitions at each position along G-tracts (stars) preceded and followed by a T (TG[n]T, left), C (CG[n]C), center) and A (AG[n]A, right) as a function of tract length. (E) Percent transitions at base pairs (stars) preceding or following A-tracts (left) and G-tracts (right) as a function of tract length (n). *, mutated position.
